Population By Education, Occupation, Labor Force Demographics
Please refer to the tables below for a more detailed breakdown of all education, occupation, and labor force demographics.
|
POPULATION 25+ BY EDUCATIONAL |
|
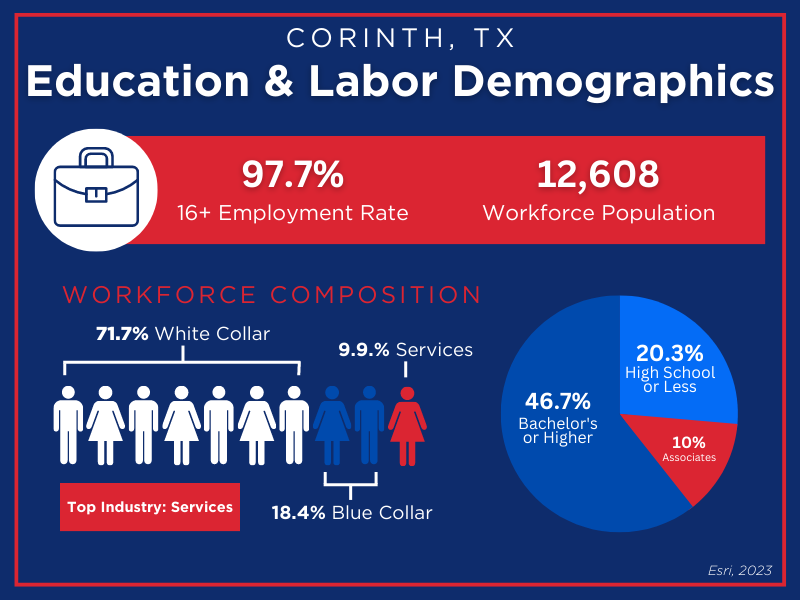
| Total | 15,251 |
| Less than 9th Grade | 3.0% |
| 9th - 12th Grade, No Diploma | 3.4% |
| High School Graduate | 13.9% |
| Some College, No Degree | 20.3% |
| Associate Degree | 10.0% |
| Bachelor's Degree | 31.1% |
| Graduate/Professional Degree | 15.6% |
| CIVILIAN POPULATION 16 AND OVER IN LABOR FORCE |
|
| Total Population (2023) | 22,687 |
| Civilian Employed | 97.7% |
| Civilian Unemployed (Unemployment Rate) | 2.3% |
| EMPLOYED POPULATION 16 AND OVER BY OCCUPATION |
|
| Total (2023) | 12,312 |
| White Collar | 71.7% |
|
*Management/Business/Financial |
22.7% |
| *Professional | 29.6% |
| *Sales | 7.6% |
| *Administrative Support | 11.8% |
| Services | 9.9% |
| Blue Collar | 18.4% |
| *Farming/Forestry/Fishing | 0.0% |
| *Construction/Extraction | 4.6% |
| *Installation/Maintenance/Repair | 3.4% |
| *Production | 3.1% |
| *Transportation/Material Moving | 7.3% |